 Secure Document Sharing
When Numbers Mislead Us Part II: Stupid Chart Tricks
Stupid Chart Tricks
In my last blog post, we explored how to discriminate between helpful and misleading financial charts and graphs. Scrutinizing the source of the material and whether it has undergone robust peer review is one of the best ways to determine the likely quality of an illustration without further ado. Beyond that, it helps to understand some of the tricks that can be – and sometimes are – played in presenting data.
Whether conceived in ignorance or deceit, a poorly crafted illustration can seriously skew your view of reality. The most common kind of stupid chart tricks are those that result in misleading scales. Think of it like the ubiquitous “Objects in the mirror may appear closer than they are,” except without the accompanying warning. There are several ways to lay out data so the results appear either larger or smaller than life, including:
Apples and Oranges Comparisons
Using two different scales to (mis)compare two different markets, fabricating relationships or expected outcomes that don’t actually exist. Josh Brown provides us with an illustration of this error in action on his Reformed Broker blog post, “Lying with Charts.” (Strong language alert.)Fruity Scales
A popular mind-game trick is to write a color but depict it in a different color and ask the viewer to state the word itself. Try it: Blue. You probably had to shift gears to avoid saying orange. Likewise, the mind can be all too easily deceived if an author presents a particular visual scale that does not reflect the actual numbers. Here’s a good Forbes article by graphical display specialist Naomi Robbins, presenting this stupid chart trick. We’ve also illustrated here how it’s possible to deceive by presenting the correct numbers, but playing fast and loose with the scale to deceive (whether innocently or by intention).
Normal Graph
Improper Graph
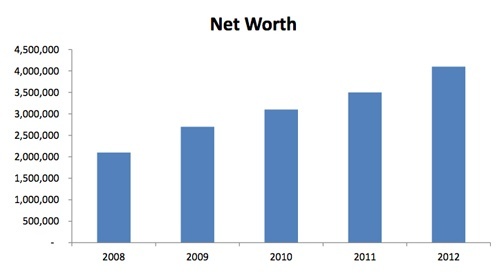
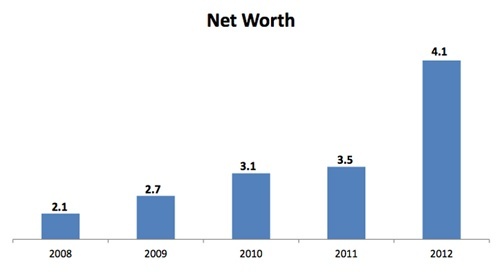
Cherry-picking the Starting Point
An all-too-common confusion occurs when the author alters the starting point from zero to an arbitrary number. In doing so, the resulting illustration can look more dramatically steep than is really the case. Here’s an NPR article featuring data visualization specialists Stephen Few and Nathan Yau analyzing this concern.
To give our own dramatic illustration, say that your sales units increased from 20 to 20.5 in 2012. If you showed this increase on a scale of 0–25, the number would appear modest. Display it on a scale of 20–21 and it would resemble an enormous leap. The best choice of all may be to shift the scale to percentage points or logarithmic data rather than the raw numbers to better communicate the desired message. Trusting that the author has selected the right presentation method without resorting to deceptive or ignorant trickery is where the peer-review and credentialed experience comes in handy.
A Mixed Bag
Sometimes, charts and graphs are accurate enough, but they just don’t tell the story nearly as well as they could. Some concerns that can occur on this count include:
- Connecting discrete data points along a timeline to imply a false continuum when there is none
- Failing to properly align a multi-chart series for best comparisons
- Using pie charts when bar charts would be considerably easier to quickly decipher
- Using charts at all when a numerical table would likely be a faster read
- Failing to best showcase the pertinent data with clean design
And so on. You get the (data) point. When it comes to financial charts and graphs, looks can deceive. It’s another reason that a SAGEbroadview advisor can help.